Replace the Filter and Jet Regulator
Manage replacement schedules and document when replacements are performed at each sampling location. Your team can see which replacements are due and which have been completed.
Hygiene Software for Your Facility
Prochorus Analytics
Prochorus Analytics helps your team with flushing, filter replacements, and aerator replacements. Assign tasks to your water outlets and keep track of their completion and documentation.
Manage replacement schedules and document when replacements are performed at each sampling location. Your team can see which replacements are due and which have been completed.
Schedule recurring flushing operations and record their completion on-site. Tasks and documentation remain assigned to the correct sampling point.
Master data, documents, and usage reports help your team track the work being done at the facility. Analytics is available as a web portal and a PWA.
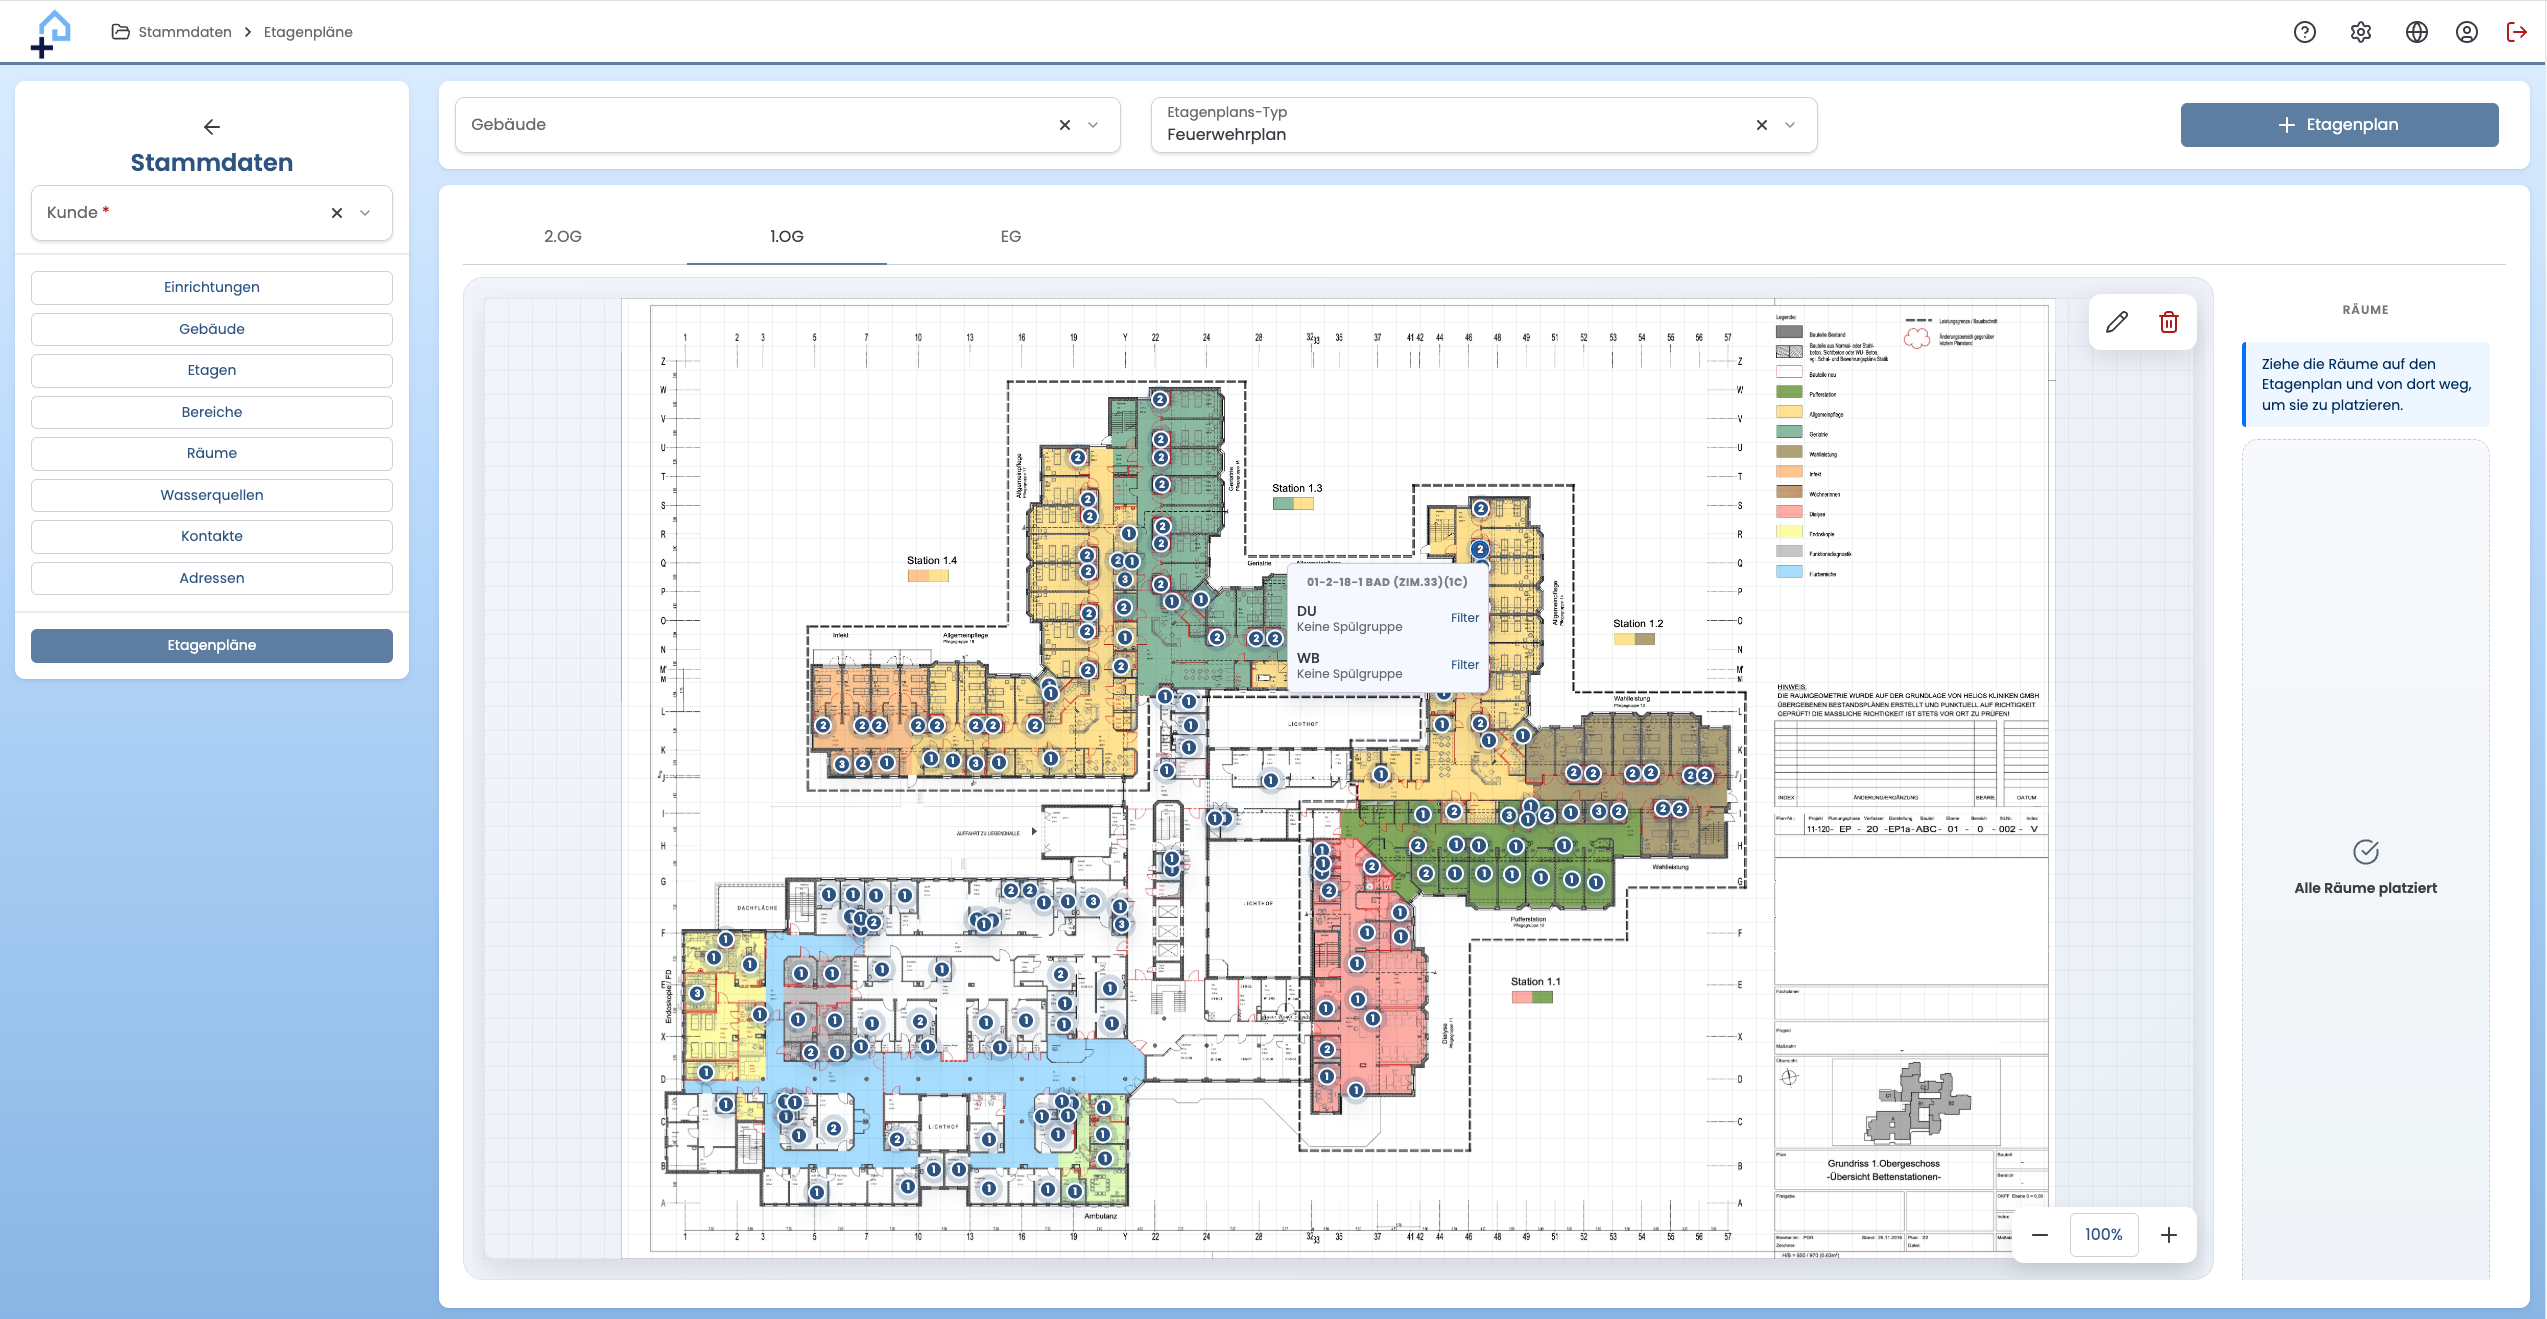
Assign pickup locations directly on the floor plan and quickly find the relevant information in the right place.
SHAPTH (Schnittstellenharmonisierung und Austauschplattform Trinkwasserhygiene) is the German states' platform through which labs send their test reports to operators and health authorities. The findings are provided in the XWasser standard: an XML file with all measured values, units and sampling points.
On import, Prochorus Analytics takes over all measured values with their units without retyping, suggests the matching sampling location for each sampling point and recognizes lab corrections as a new version.
A direct interface to SHAPTH is in development. Findings will then arrive in Prochorus Analytics automatically, without exporting a file.
Track every parameter per sampling location for up to 36 months. Exceeded values stand out immediately in the measurement trend.
Sampling points are assigned to your sampling locations with building, floor and room. Once confirmed, Analytics recognizes them in the next report.
Create actions for a finding with a responsible person and a due date. The person in charge is notified by email.
The dashboard shows reports with exceeded values that have no planned action yet, as well as open and overdue follow-up actions.
Findings are reviewed and approved. Corrections from the lab are imported as a new version, and earlier states are kept in full.
Besides XWasser files, lab reports can be captured from PDF with AI support or entered manually. The original remains available at any time.
The Prochorus Suite
Analytics supports hygiene management at your facility. EasySample organizes sample collection in the lab. Together, they form the Prochorus Suite.
Do you have your own lab, or does your lab use Prochorus EasySample? Great—that means your sample results are available directly in Analytics. Alternatively, you can also use our AI-powered result analysis. Your hygiene team can then view the results right where they organize their actions.
Let's get to know your processes
Whether you're a single facility, a hospital network, or a laboratory: In a personalized demo, we'll address the topics that matter most to your team.